Visualize
-
Matplotlib
Matplotlib is a Python 2D plotting library. Official Website, Gallery
IPython Notebooks
-
Seaborn is a library for making attractive and informative statistical graphics in Python Official Website, Gallery
IPython Notebooks
Here are some plots:
2D Plots (Scatter-plot, Step-plot, Bar-plot, Fill Between-Plot)
fig, axes = plt.subplots( 1, 4, figsize=(12,3))
axes[0].scatter( x, x + 0.25*np.random.randn( len(x)))
axes[0].set_title("scatter")

axes[1].step( n, n**2, lw=2 )
axes[1].set_title("step")

axes[2].bar( n, n**2, align="center", width=0.5, alpha=0.5)
axes[2].set_title("bar")

axes[3].fill_between( x, x**2, x**3, color="green", alpha=0.5 )
axes[3].set_title("fill_between")

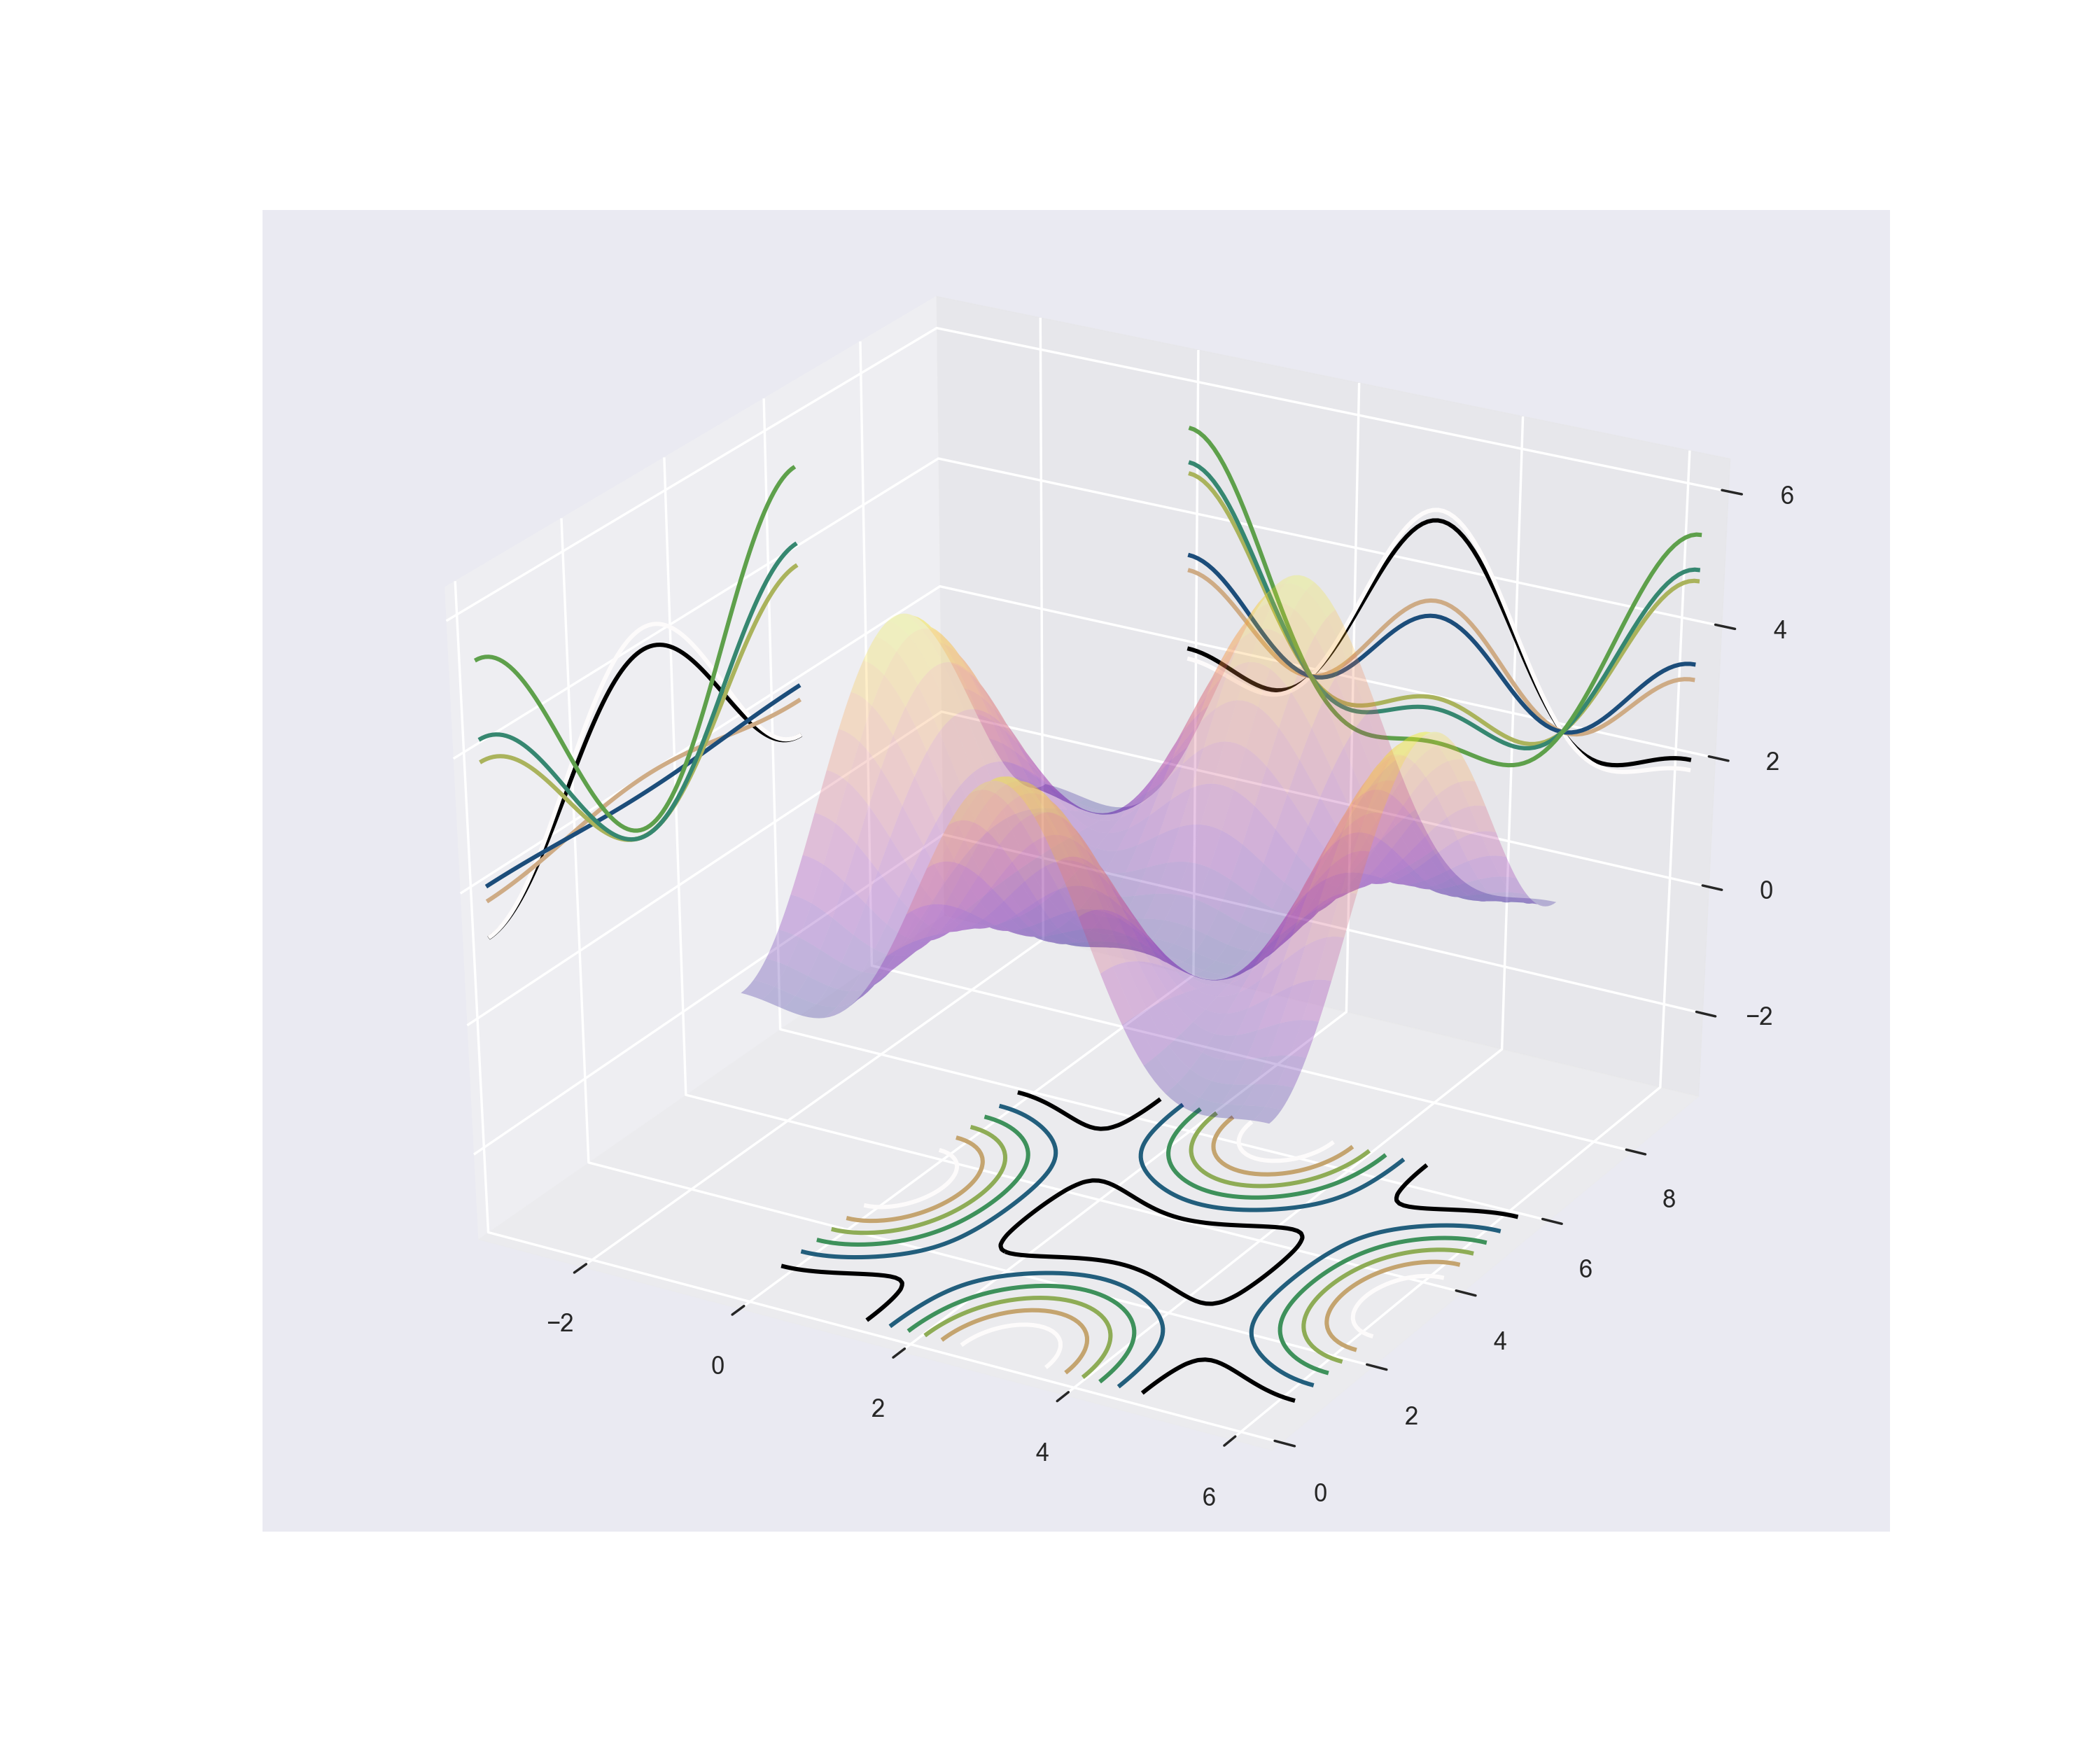
A 3D Plot (Contour plots with projection)
fig = plt.figure( figsize=( 12,10 ) )
ax = fig.add_subplot( 1,1,1, projection='3d' )
ax.plot_surface( X, Y, Z, rstride=4, cstride=4, alpha=0.25,cmap='plasma' )
cset = ax.contour( X, Y, Z, zdir='z', offset=-np.pi, cmap='gist_earth' )
cset = ax.contour( X, Y, Z, zdir='x', offset=-np.pi, cmap='gist_earth' )
cset = ax.contour( X, Y, Z, zdir='y', offset=3*np.pi, cmap='gist_earth' )
ax.set_xlim3d( -np.pi, 2*np.pi)
ax.set_ylim3d( 0, 3*np.pi )
ax.set_zlim3d( -np.pi, 2*np.pi )

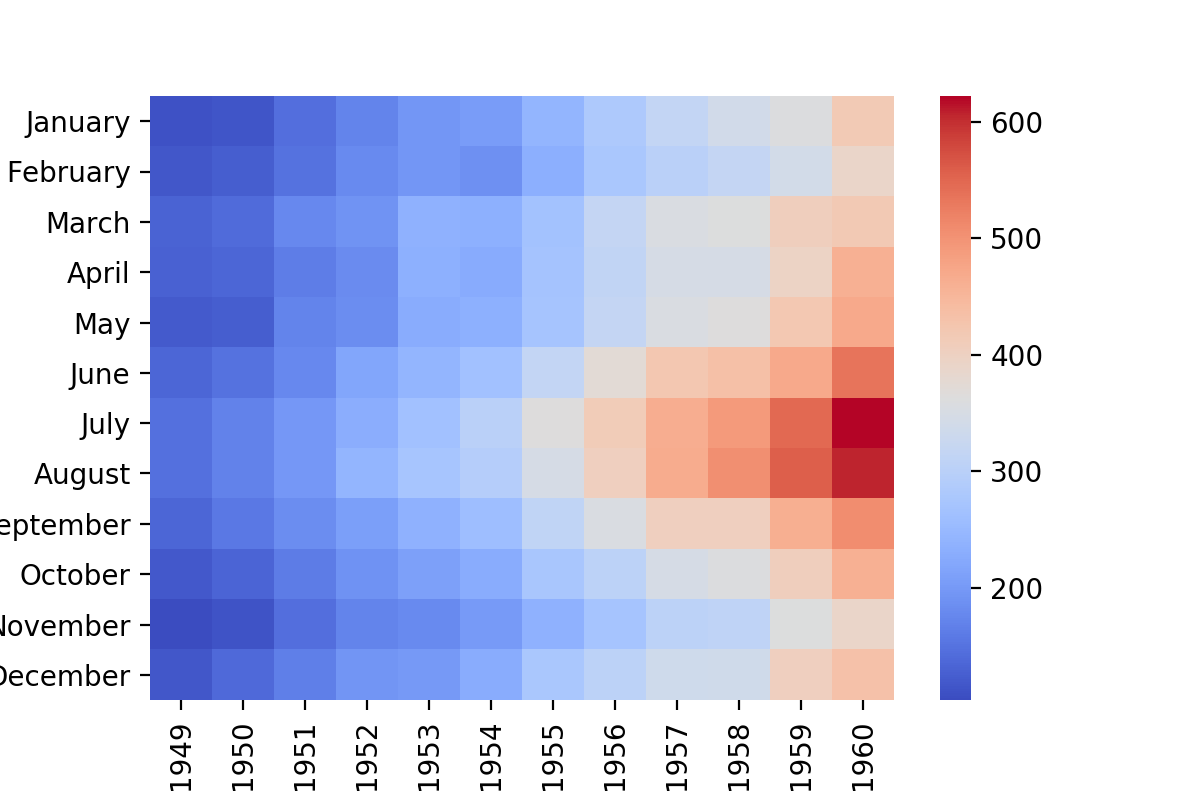
Heatmap
flights = sns.load_dataset( 'flights' )
fpt=flights.pivot_table( index='month',columns='year',values='passengers' )
sns.heatmap( fpt, cmap='coolwarm' )

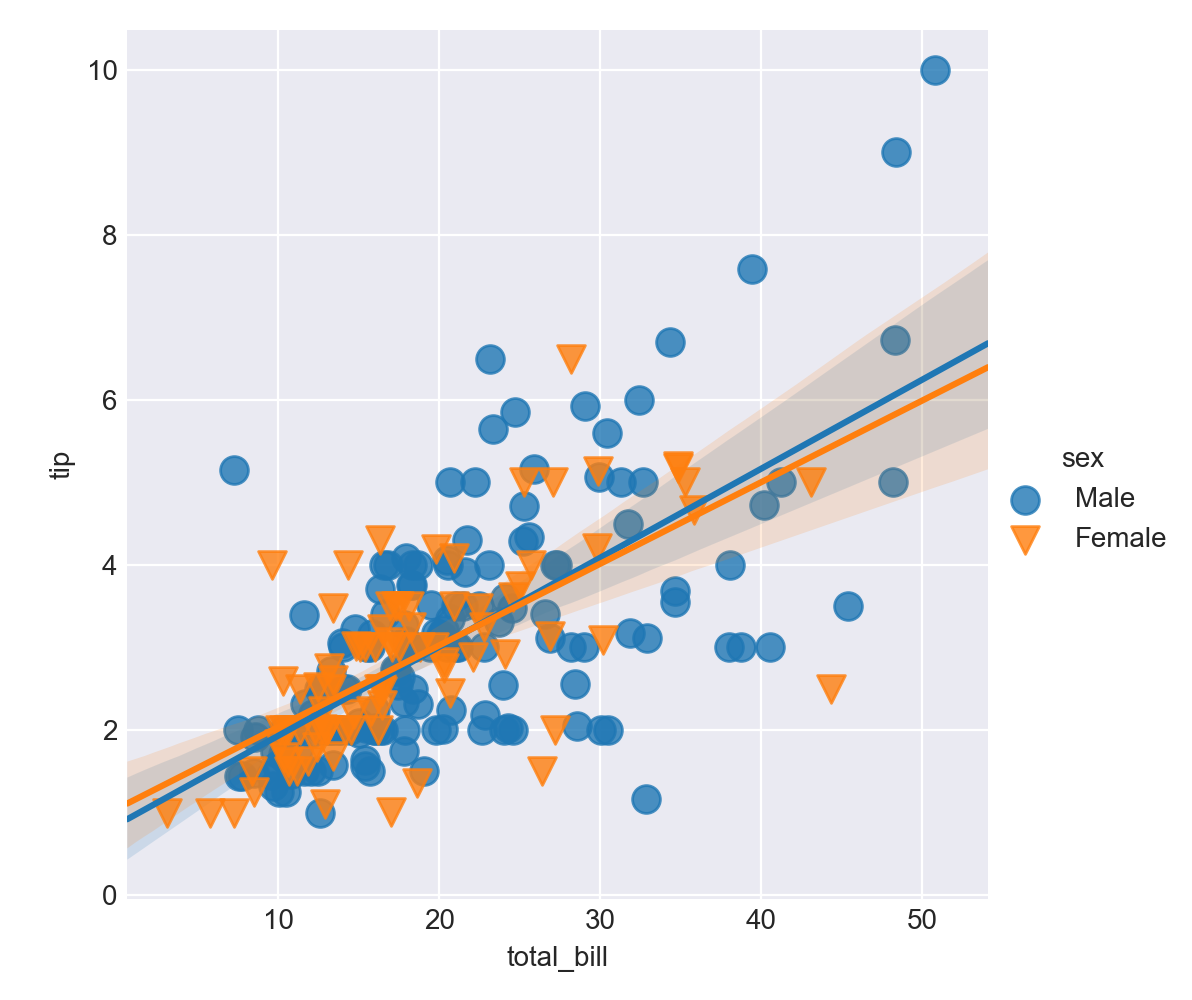
Linear Model Plot
tips = sns.load_dataset('tips')
sns.lmplot(x='total_bill',y='tip',data=tips,hue='sex',markers=['o','v'],scatter_kws={'s':100})

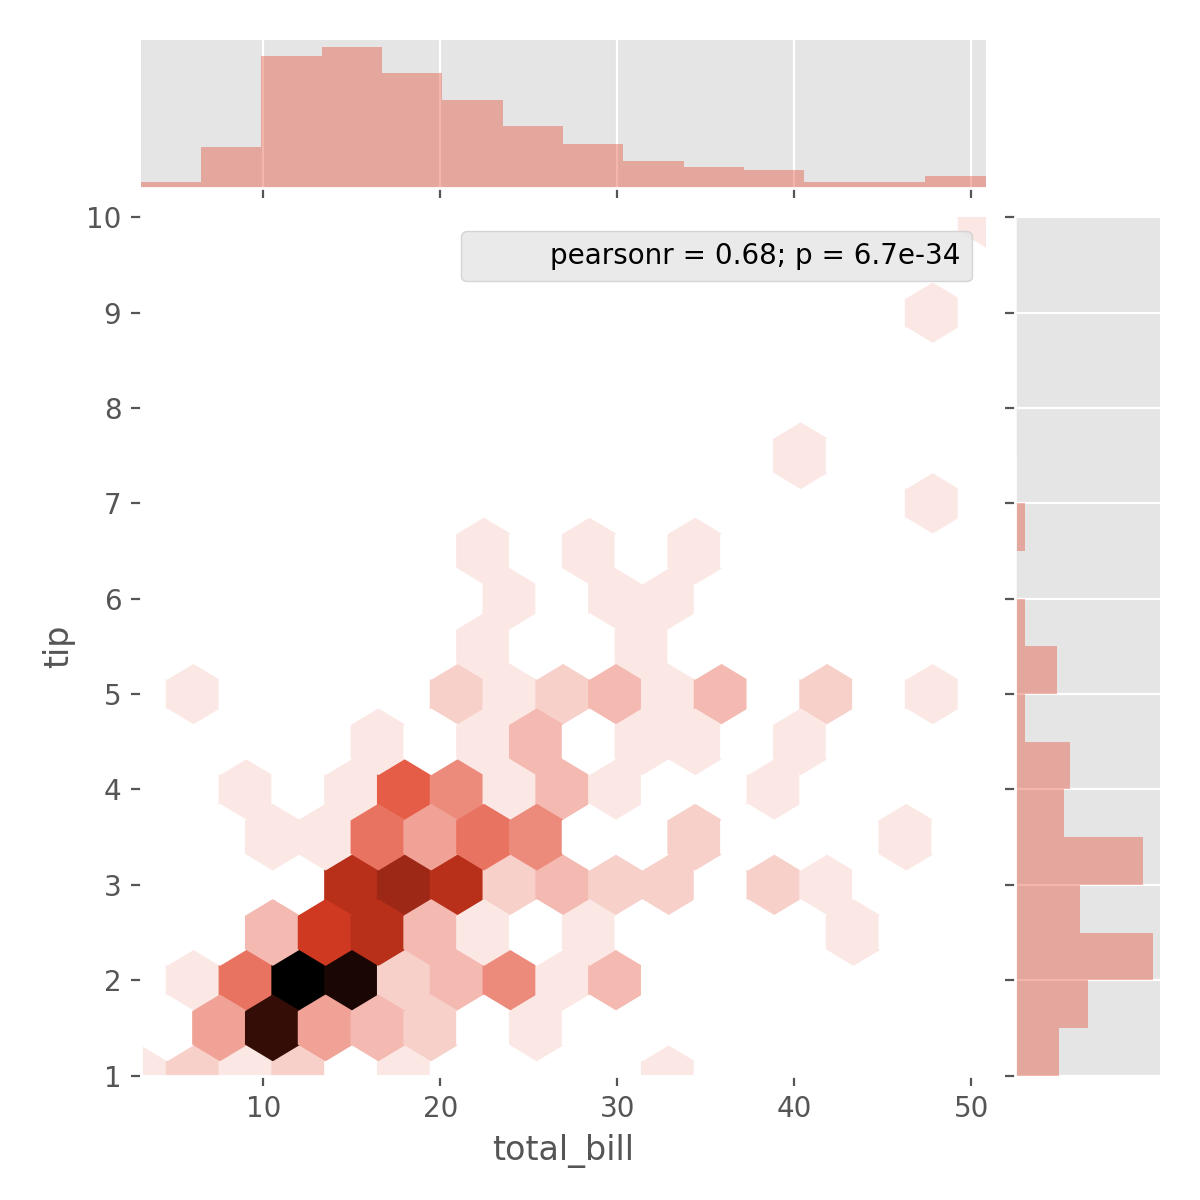
Joint Plot
tips = sns.load_dataset('tips')
sns.jointplot(x='total_bill',y='tip',data=tips,kind='hex')
